For billing compliance, coding, and revenue integrity professionals, quickly interpreting and acting on data is vital for maintaining accuracy, improving efficiency, and safeguarding revenue. Data is the backbone of decision-making in revenue cycle management (RCM), and this is where modern data visualizations and intuitive reporting tools come into play. Data visualizations and reporting make complex data accessible and actionable, empowering healthcare organizations to stay compliant, safeguard revenue, and ultimately deliver better patient care.
Why Data Visualizations Matter
1. Simplifying Complexity
Healthcare data is intricate, often involving vast amounts of information spanning billing audits, compliance checks, and coding accuracy. Data visualizations simplify this complexity by presenting insights in an easily digestible format.
2. Enhancing Decision-Making
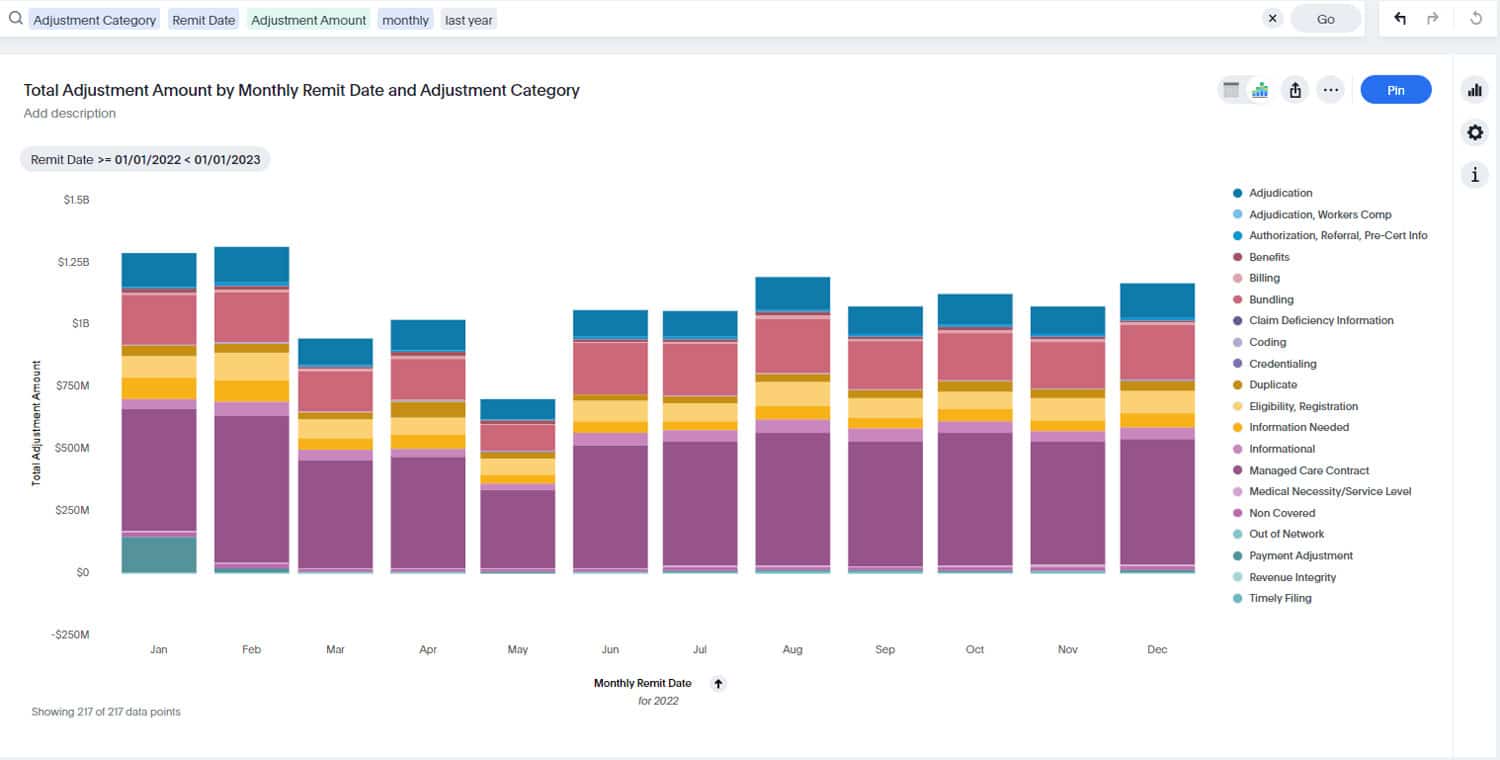
Visualized data instantly makes patterns and outliers apparent. For example, a line graph highlighting billing error trends over time allows revenue integrity teams to pinpoint periods of increased risk quickly. This clarity drives faster, more informed decisions.
3. Transforming Challenges into Opportunities
The benefits of robust data visualizations extend beyond efficiency. They also contribute to a culture of transparency and continuous improvement. When stakeholders have access to clear, actionable insights, they can:
- Streamline workflows by focusing on resources where they’re needed most.
- Drive accountability with visible metrics that track progress and outcomes.
- Achieve compliance goals by addressing risks proactively rather than reactively.
4. Improving Stakeholder Communication
Not everyone who relies on compliance and revenue data is a technical expert. Executives and other stakeholders often prefer summaries over spreadsheets. Visual reports bridge this gap, enabling seamless communication and fostering team alignment.
MDaudit: Communicating Results
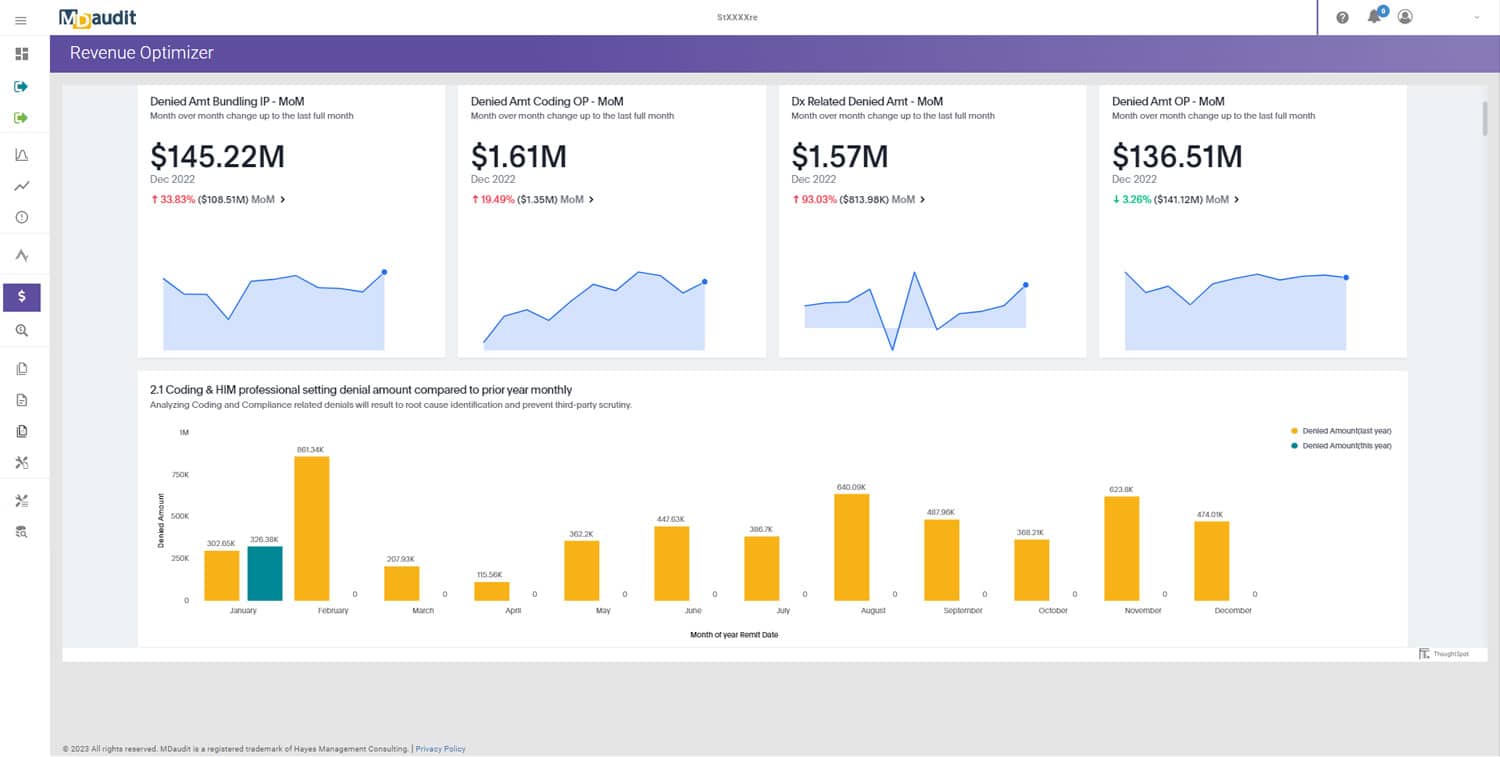
MDaudit’s redesigned reports and dashboards take data visualizations to the next level by incorporating modern aesthetics that provide clean layouts and interactive charts, offering stakeholders a deeper dive into specific areas of concern or success. These reports make RCM insights easily consumable while communicating actionable outcomes.
· Billing Compliance Monitoring
MDaudit’s redesigned reports display real-time compliance trends, helping organizations proactively identify and mitigate risks. For instance, a line chart showing a provider’s past audit performance can assist during provider education.
· Optimizing Revenue Integrity
Revenue integrity teams can track the financial impacts of denied claims and spot opportunities for improvement through visualizations. Heat maps, for example, can highlight facilities or service lines where revenue leakage occurs most frequently.
· Enhancing Coding Accuracy
Visualized data on error patterns for coding teams—broken down by coder, specialty, or code type—provides actionable insights to drive training initiatives and improve performance.
As healthcare organizations face growing regulatory scrutiny and revenue pressures, the need for effective data utilization will only increase. By empowering billing compliance, revenue integrity, and coding professionals with clear and impactful visualizations, these tools ensure that data-driven decision-making becomes second nature. If your organization is ready to unlock the full potential of its data, explore MDaudit and see how our reports can transform your processes.


